Tutorial
Here we provide a quick tutorial for using SlyPI. We focus on using SlyPI to upload models from the command line. More advanced scenarios, such as using SlyPI from within other Python scripts, will be discussed later.
Command Line
Every SlyPI script can be accessed from the command line using the Python module
syntax. Every script has a help function. For example, the following shows
the help for the list_markings.py script.
python -m slypi.util.list_markings --help
usage: list_markings.py [-h] --host HOST [--port PORT]
                        [--http-proxy HTTP_PROXY] [--https-proxy HTTPS_PROXY]
                        [--verify VERIFY] [--no-verify]
                        [--file-slice-size FILE_SLICE_SIZE] [--user USER]
                        [--password PASSWORD] [--kerberos]
                        [--log-level {debug,info,warning,error,critical}]

Display available marking types supported by the Slycat server.

options:
  -h, --help            show this help message and exit
  --host HOST           Root URL of the Slycat server.
  --port PORT           Port of the Slycat server.
  --http-proxy HTTP_PROXY
                        HTTP proxy URL. Default: ''.
  --https-proxy HTTPS_PROXY
                        HTTPS proxy URL. Default: ''.
  --verify VERIFY       Specify a certificate to use for HTTPS host
                        certificate verification.
  --no-verify           Disable HTTPS host certificate verification.
  --file-slice-size FILE_SLICE_SIZE
                        Maximum number of bytes to upload before slicing files
                        (i.e. before uploading in chunks). Default: 10000000.
  --user USER           Slycat username. Default: 'docs'
  --password PASSWORD   User password.
  --kerberos            Use Kerberos authentication. Default: False.
  --log-level {debug,info,warning,error,critical}
                        Log level. Default: 'info'.
Connection to Server
The easiest way to check if your connection to the Slycat server is working is in fact
to use the list_markings.py script.
python -m slypi.util.list_markings --host https://your-host --kerberos
You will of course need to use the appropriate authentication for your server.
Data
The data used in these examples can be found in the example-data directory in the SlyPI repository. The data sets consist of the following:
cars.csv – A dataset describing cars from 1970, 1976, and 1982. This was converted to .csv from the carsmall.mat dataset in Matlab.
weather-dac-gen-pca.zip – A dataset containing weather measurements over the year 2014 for the 100 largest cities in the United States.
spinodal – A small subset from a larger study using numerical simulation data to model microstructure evolution.
The spinodal dataset is described in greater detail in the papers [Desai2024], [Hu2022], and [Stewart2020].
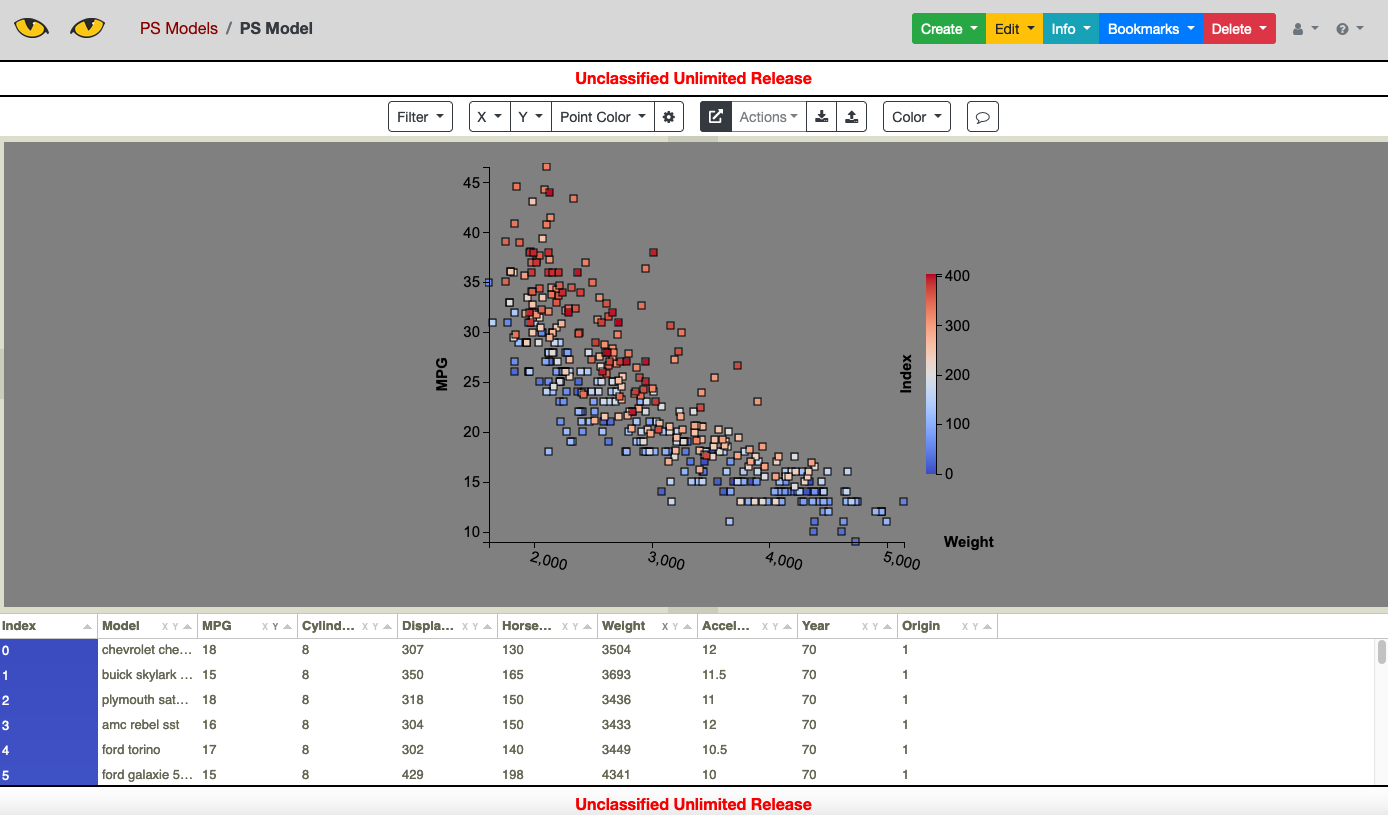
Parameter Space
The Slycat Parameter Space model is the simplest way to use Slycat for visualization. A Parameter Space model performs no analysis and requires only a table in .csv format. Each row of the table describes a single data point (typically representing a single numerical simulation) and can include numerical data, strings, and even file pointers which can be display by Slycat to view images, videos, pdfs, and 3D mesh data that may be associated with a provided row.
To upload a parameter space model using the cars data to a Slycat server, use
python -m slypi.ps.upload_csv example-data/cars.csv --marking uur --project-name "PS Models"
A particular feature of interest to anyone wanting to use Parameter Space to visualize the
results of their own algorithm is the use of a (x,y) pair tag in the .csv header. (The tags
are [XY Pair X] for the x-coordinate and [XY Pair Y] for the y-coordinate.) These tags
will be recognized in Parameter Space and allow the user to select a coordinate pair for
the scatter plot display instead of having to select two single variables separately. This
feature will be demonstrated in a later example showing how to incorporate new algorithms
into Slycat.
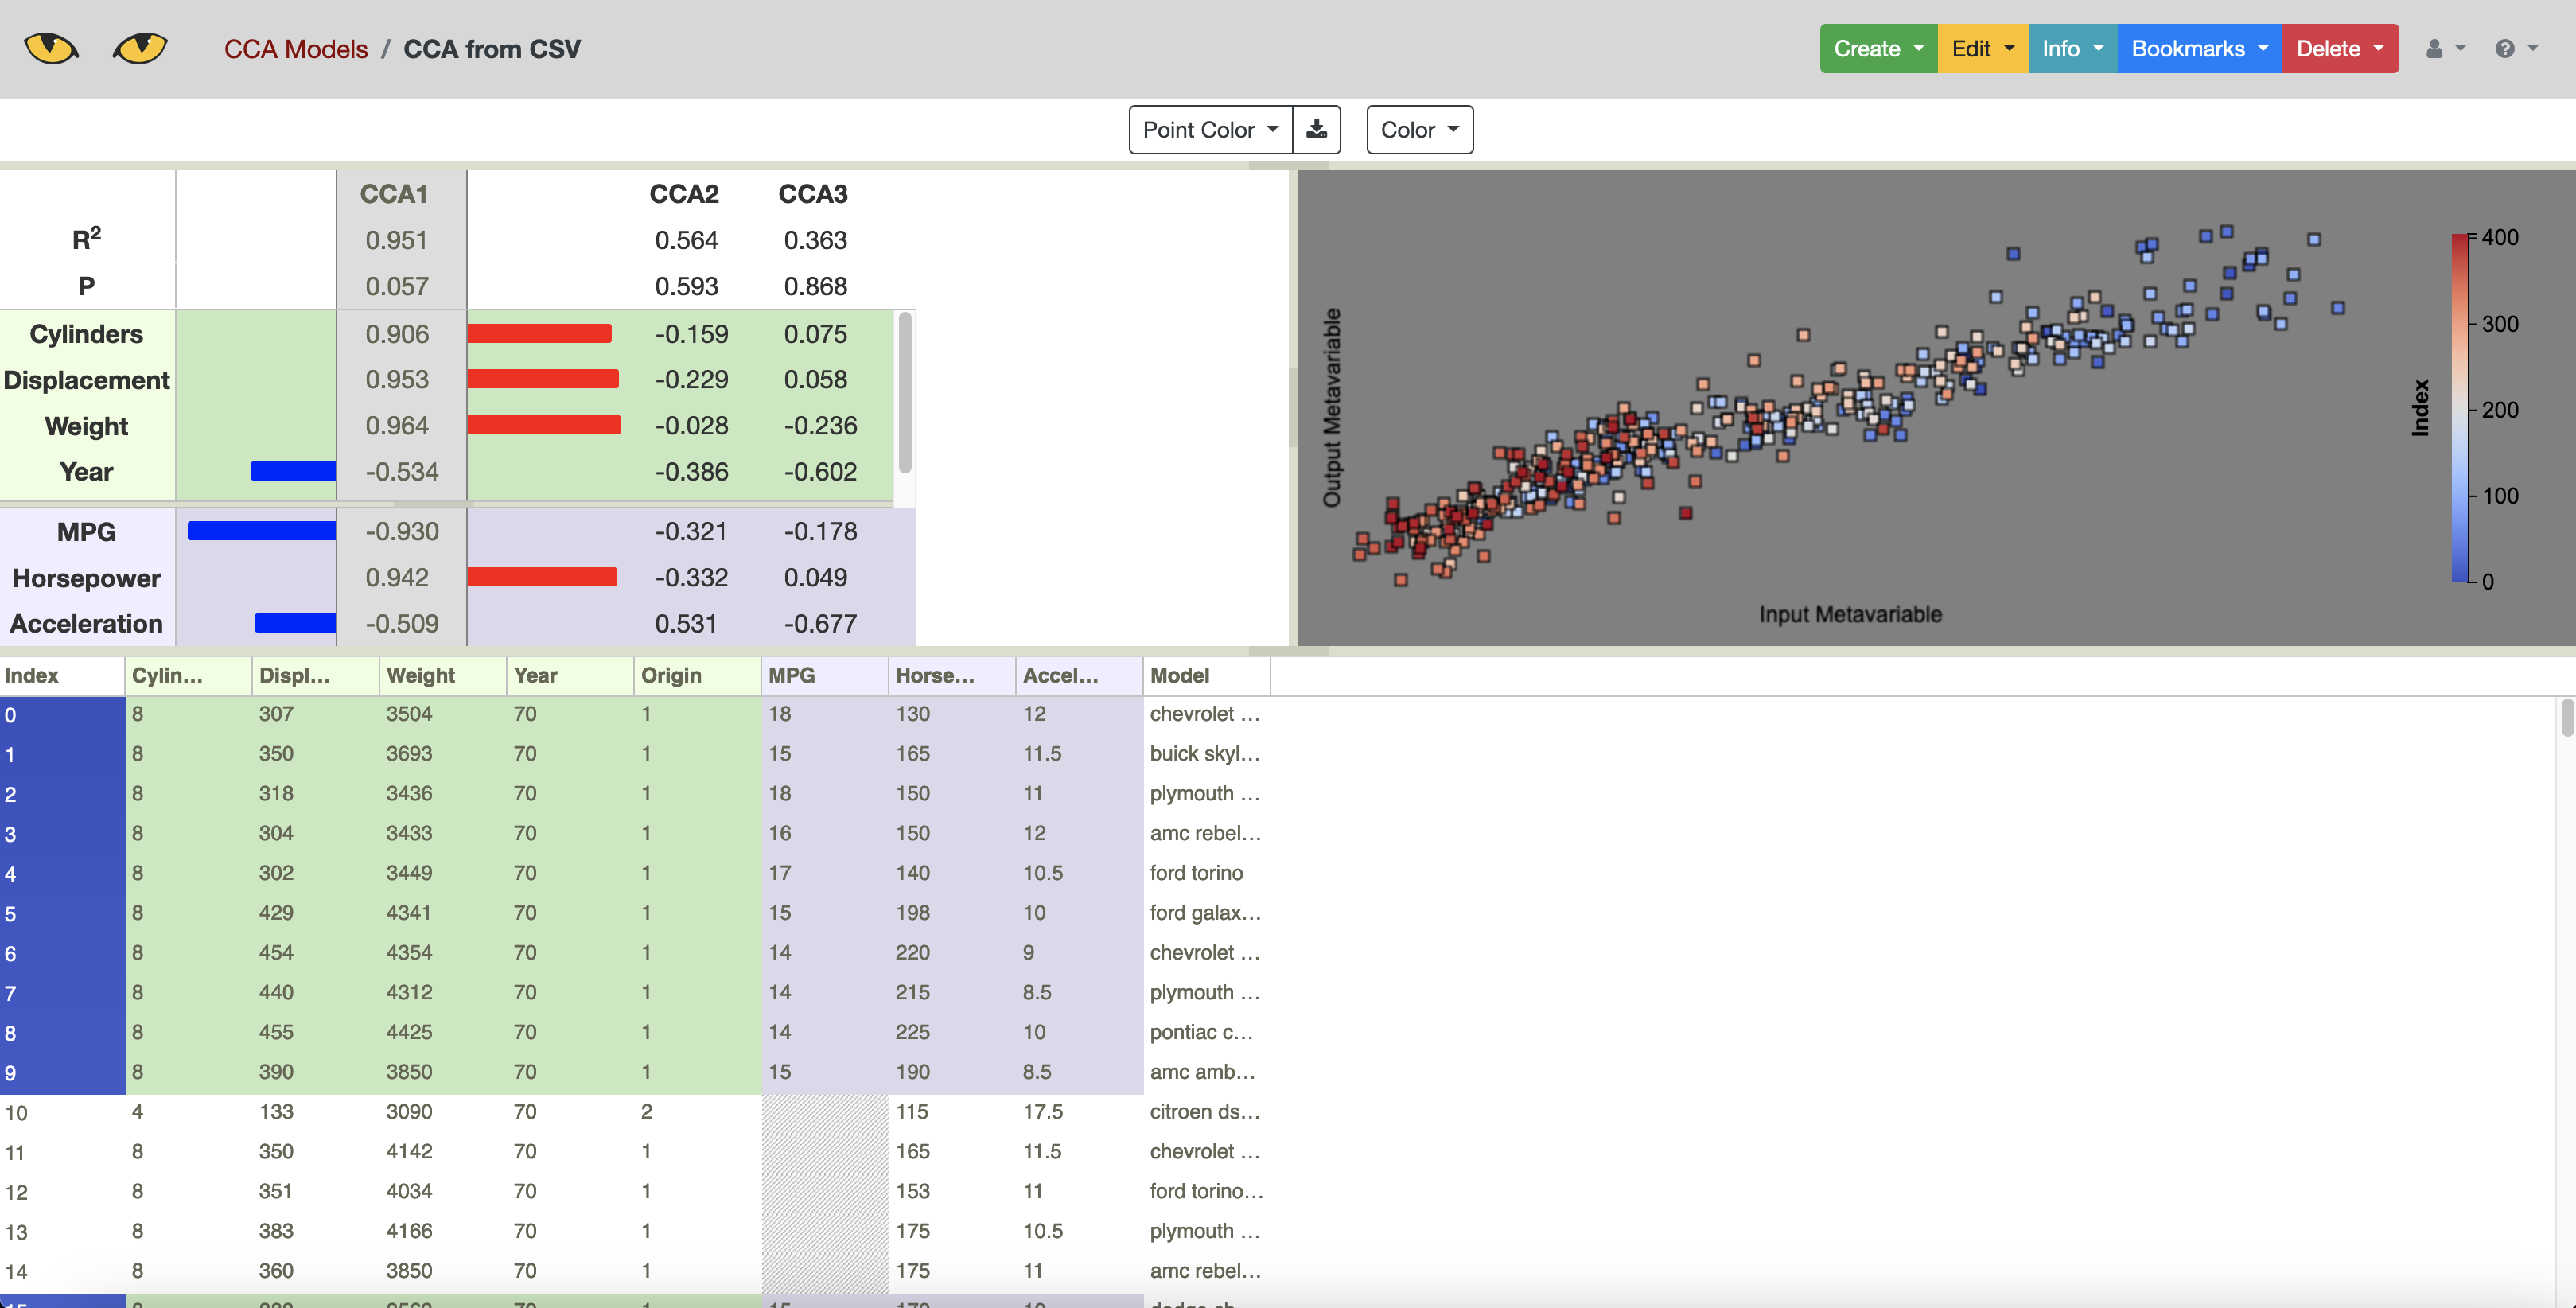
Canonical Correlation Analysis (CCA)
The Slycat CCA model performs a statistical analysis known as Canonical Correlation Analysis. CCA operates on a dataset with two type of variables, input variables and output variables, as are typically present in numerical simulation data. CCA finds the largest correlations between combinations of inputs variables (a “canonical” input) and combinations of output variables (a “canonical” output). These correlations can then be visualized in Slycat to understand which inputs most affect which outputs.
To upload a CCA model to Slycat using the cars data, use:
python -m slypi.cca.upload_csv example-data/cars.csv --input-columns Cylinders Displacement Weight Year Origin --output-columns MPG Horsepower Acceleration --project-name "CCA Models"
Dial-A-Cluster
Dial-A-Cluster (DAC) is a Slycat model used for interactive visualization of multivariate time series data. DAC allows the user to select which time series and how much those time series influence a dimension reduction using Multidimensional Scaling (MDS). By adjusting the influence of the available time series, the user can investigate clusters and correlation in their time series data. More details describing this approach and the underlying algorithms can be found in the paper [Martin2016].
To upload a DAC model into Slycat, use:
python -m slypi.dac.upload_gen example-data/weather-dac-gen-pca.zip --project-name "DAC Models"
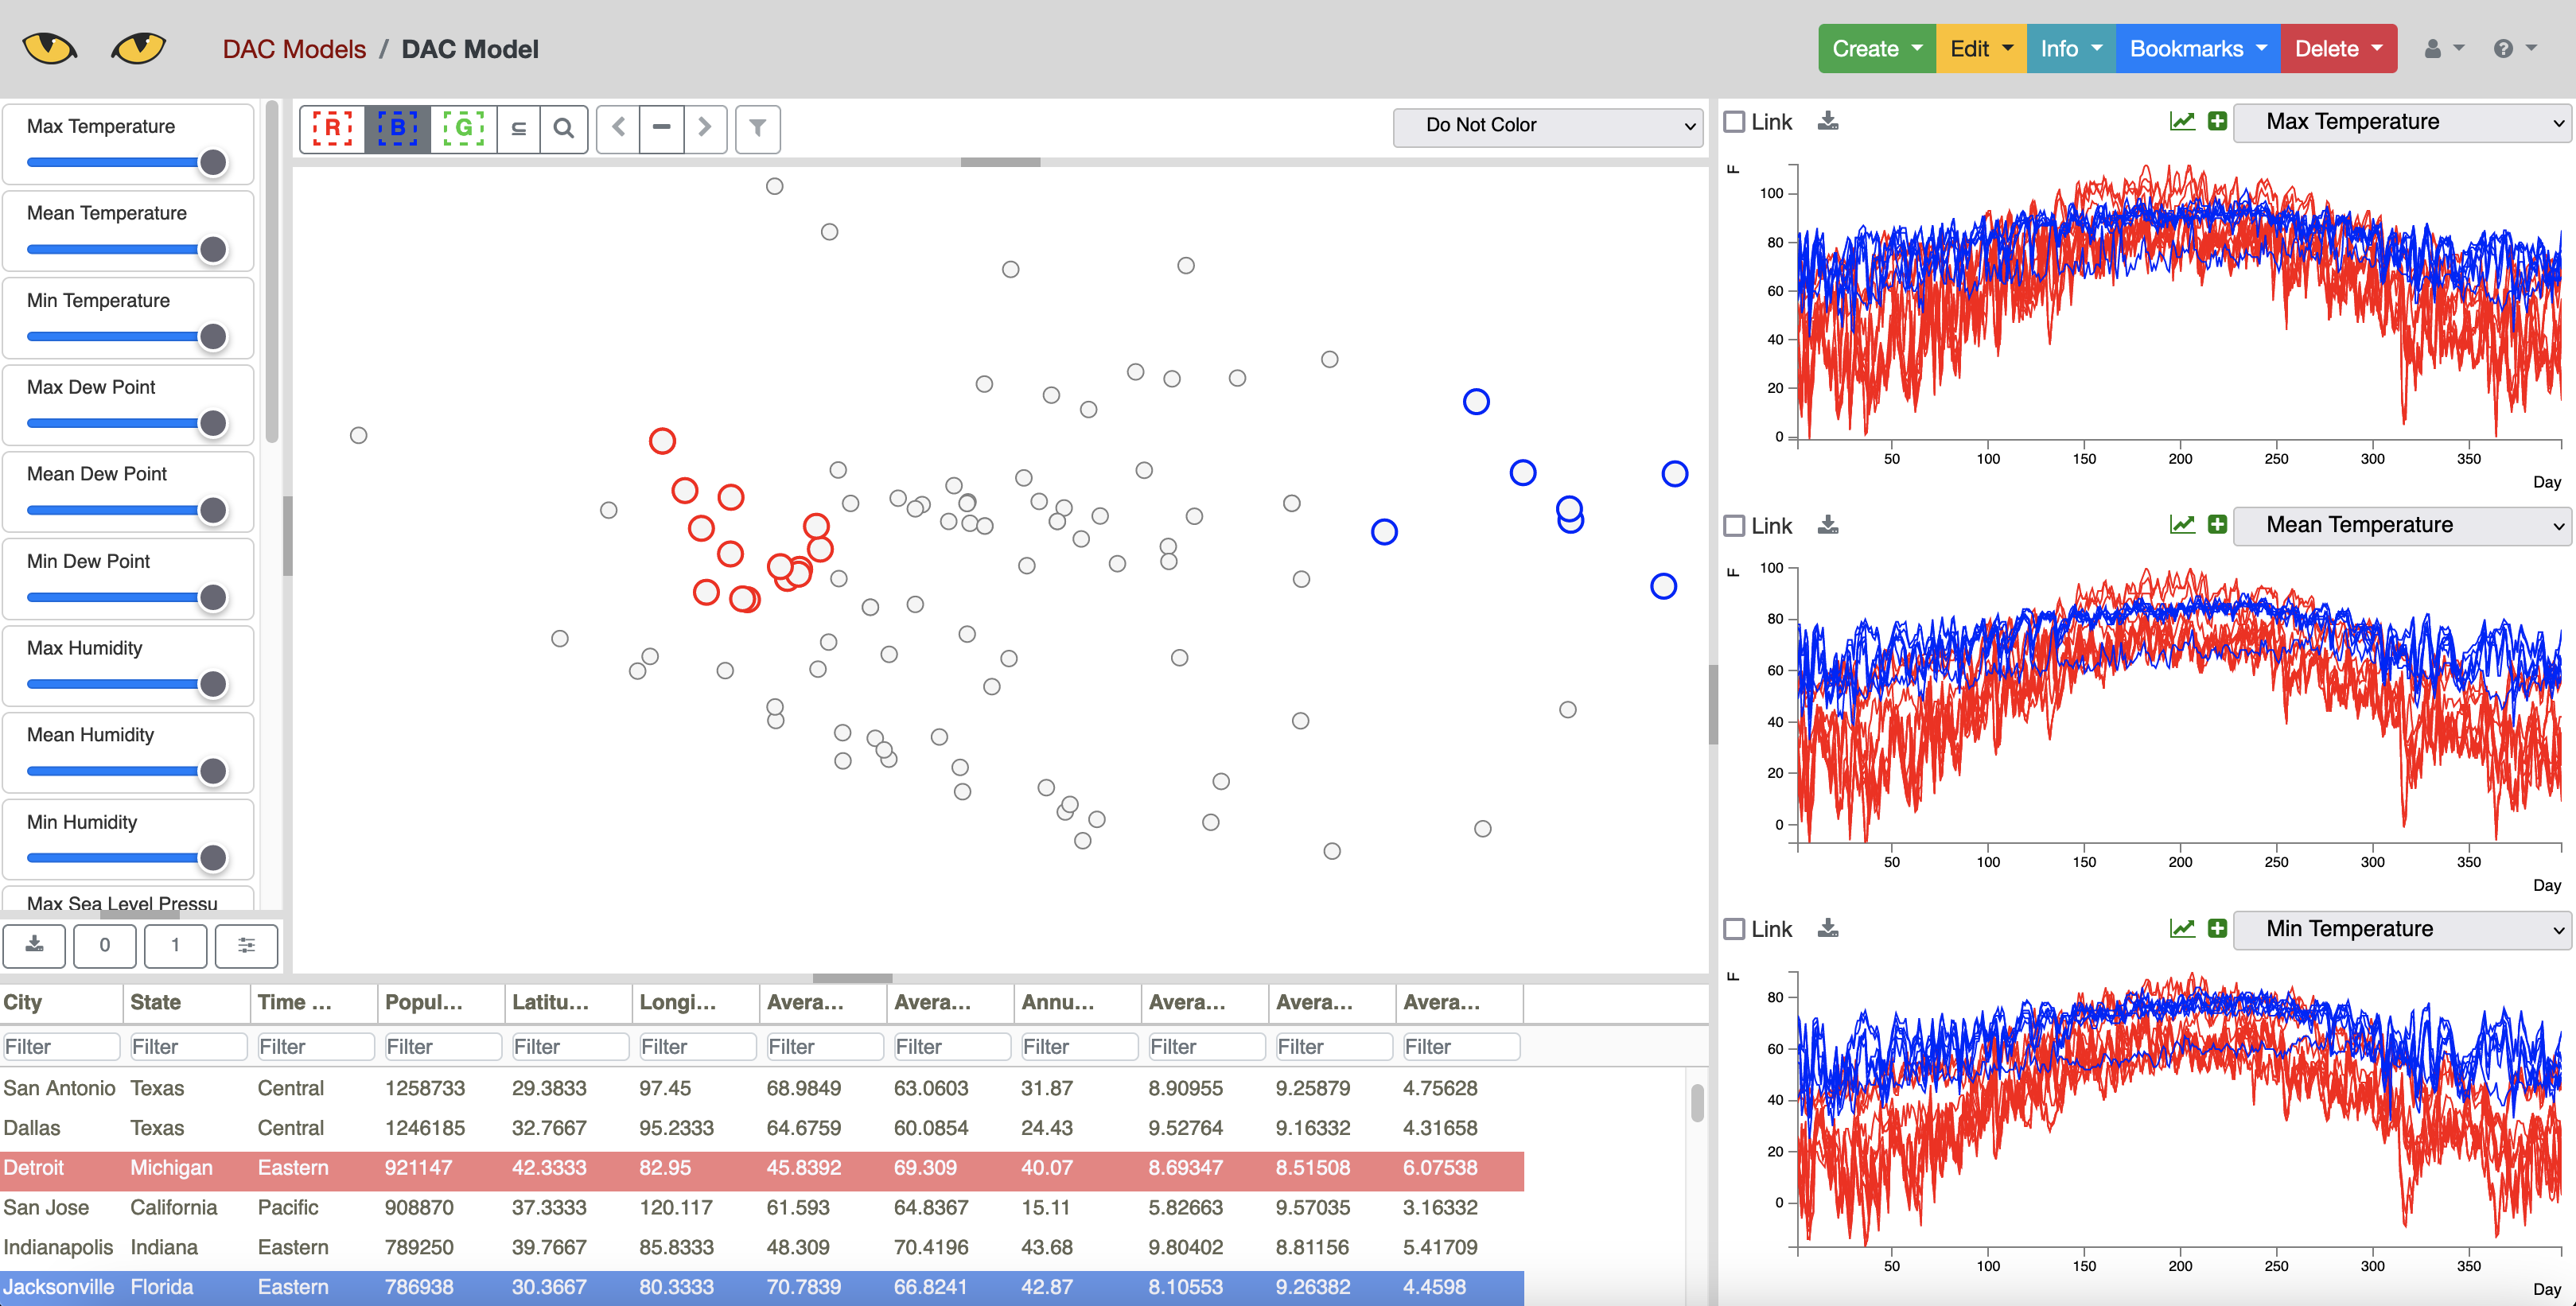
A special format is required for uploading a DAC model. An example of this format is provided in the weather-dac-gen-pca.zip file. A more detailed description of this format can be found in the Slycat User Manual at https://slycat.readthedocs.io/en/latest/manual/DAC_Manual/DACGenericFormat.html.
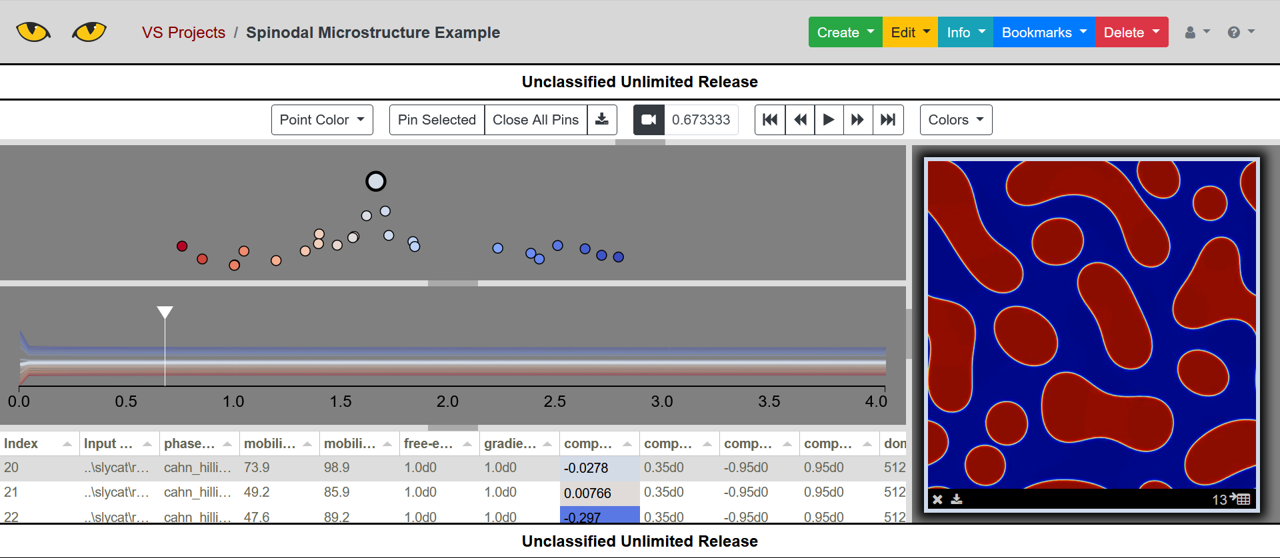
VideoSwarm
VideoSwarm models in Slycat use a time-aligned dimension reduction algorithm to visualize ensembles of videos created from numerical simulation data. Creating a VideoSwarm model involves multiple steps that are described below. For our example, we use the spinodal example dataset, which is structured as follows:
spinodal
|-- metadata.csv
|-- workdir.460
    |-- out.cahn_hilliard_0.jpg
    |-- out.cahn_hilliard_500000.jpg
    |-- ...
|-- workdir.467
|-- workdir.473
...
These files are a subset of the files that would typically be produced by running an ensemble of
numerical simulations, and are organized as would be typical for that situation. The metadata.csv
file contains a table with the inputs of each simulation run, and the folders workdir.* contain
image outputs of the simulation at selected timesteps in the files out.cahn_hilliard_*.jpg.
The first step in creating a VideoSwarm model is compiling the images produced by the simulation into videos. This can be done using:
python -m slypi.ensemble.convert --ensemble example-data/spinodal/workdir.%d --input-files out.cahn_hilliard_%d.npz --output-dir example-data/spinodal-out --csv-out movies.csv --csv-header Movie --output-format mp4 --plugin convert --suffix phase_field --over-write
The output of this command will consist of the generated movies in a new directory
example-data/spinodal-out mirroring the file structure of the input data,
with a table containing pointers to each of the movies in the file movies.csv.
The next step is to generate the VideoSwarm files to upload to Slycat by running the time-aligned dimension reduction algorithm. This is done using:
python -m slypi.ensemble.reduce --ensemble example-data/spinodal/workdir.%d --input-files out.cahn_hilliard_%d.npz --output-dir example-data/spinodal-out --algorithm PCA --time-align 10 --num-dim 2 --csv-out time-aligned-pca.csv --csv-header "Time Aligned PCA" --output-file out.cahn_hilliard_time_aligned_PCA.rd.npy --plugin vs --auto-correlate --binary --over-write
Details on the time-aligned algorithm can be found in the paper [Martin2019]. Finally, we can create the VideoSwarm model files using:
python -m slypi.ensemble.table --join example-data/spinodal/metadata.csv example-data/spinodal-out/movies.csv example-data/spinodal-out/time-aligned-pca.csv --output-dir example-data/spinodal-out --ignore-index --csv-out metadata-time-aligned-pca.csv --csv-no-index --over-write
python -m slypi.ensemble.table --expand example-data/spinodal-out/metadata-time-aligned-pca.csv --expand-header "Time Aligned PCA" --output-dir example-data/spinodal-out/vs-local --csv-out movies.csv --plugin vs --remove-expand-col --video-fps 25
These commands produces VideoSwarm formatted local files in the directory vs-files. There are four
files produced, movies.csv, movies.xcoords, movies.ycoords, and movies.trajectories.
These files can be uploaded using the VideoSwarm wizard, or using the upload script:
python -m slypi.vs.upload_local --csv-file example-data/spinodal-out/vs-local/movies.csv --xcoords-file example-data/spinodal-out/vs-local/movies.xcoords --ycoords-file example-data/spinodal-out/vs-local/movies.ycoords --traj-file example-data/spinodal-out/vs-local/movies.trajectories --video-column Movie --project-name "VS Models"
You will need to specify your own login and Slycat server details. The end result of this example is shown below.